Data | Domains
Keep Learning 
GoDataDriven 13 May, 2020


In this blog post I show how to read Kafka consumer offsets, get them into Prometheus and visualize using Grafana. This is very useful if you’re running a streaming application reading from Kafka and want to know if your application is up to speed or lagging behind.
So you’ve written e.g. a Spark ETL pipeline reading from a Kafka topic. There are several options for storing the topic offsets to keep track of which offset was last read. One of them is storing the offsets in Kafka itself, which will be stored in an internal topic __consumer_offsets. If you’re using the Kafka Consumer API (introduced in Kafka 0.9), your consumer will be managed in a consumer group, and you will be able to read the offsets with a Bash utility script supplied with the Kafka binaries.
Read all consumer groups:
./kafka-consumer-groups.sh --bootstrap-server 127.0.0.1:9092 --list
my-group-01
my-group-02
my-group-03
Read the offsets for a specified consumer group:
./kafka-consumer-groups.sh --bootstrap-server 127.0.0.1:9092 --describe --group my-group-01
TOPIC   PARTITION  CURRENT-OFFSET  LOG-END-OFFSET  LAG  CONSUMER-ID                                      HOST        CLIENT-ID
topic1  0          11412           11415           3    consumer-1-1555f25e-bc14-4e61-a82d-f36dd06ef46f  /127.0.0.1  consumer-1
topic1  1          11355           11355           0    consumer-1-1555f25e-bc14-4e61-a82d-f36dd06ef46f  /127.0.0.1  consumer-1
topic1  2          11103           11104           1    consumer-1-1555f25e-bc14-4e61-a82d-f36dd06ef46f  /127.0.0.1  consumer-1
topic1  3          11085           11085           0    consumer-1-1555f25e-bc14-4e61-a82d-f36dd06ef46f  /127.0.0.1  consumer-1
topic1  4          11282           11282           0    consumer-1-1555f25e-bc14-4e61-a82d-f36dd06ef46f  /127.0.0.1  consumer-1
Offsets are stored per consumer, per topic, per partition. The above example shows one consumer, reading from one topic, from five partitions. The total lag is four messages since two partitions are lagging: partition 0 is lagging 3 messages and partition 2 is lagging one message. This is nice to know, but you don’t want to read these raw numbers every few seconds. Enter a time series database: Prometheus.
Prometheus works via a pull-model so we need to expose the lag in a format so that Prometheus can scrape and read it. There are several exporters on the internet. I tested the first four I found on Google and went for https://github.com/echojc/kafka-offset-exporter. It’s written in Go and you’ll have to build the binary yourself:
go get github.com/echojc/kafka-offset-exporter
cd $GOPATH/src/github.com/echojc/kafka-offset-exporter
go build .
I’ve made a PR adding a Dockerfile, this also includes instructions on how to build with some optimization.
Once you have built the Go binary, run it: ./kafka-offset-exporter. By default it reads from your-machine:9092, and only fetches topic offsets and not consumer group offsets, so pass arguments to fetch offsets for all groups and all non-internal topics:
./kafka-offset-exporter -brokers 127.0.0.1:9092 -topics ^[^_].* -groups .
By default this runs on port 9000:
> curl localhost:9000

# HELP kafka_offset_consumer Current offset for a consumer group
# TYPE kafka_offset_consumer gauge
kafka_offset_consumer{group="my-group-01",partition="0",topic="topic1"} 11412
kafka_offset_consumer{group="my-group-01",partition="1",topic="topic1"} 11355
kafka_offset_consumer{group="my-group-01",partition="2",topic="topic1"} 11103
kafka_offset_consumer{group="my-group-01",partition="3",topic="topic1"} 11085
kafka_offset_consumer{group="my-group-01",partition="4",topic="topic1"} 11282
# HELP kafka_offset_newest Newest offset for a partition
# TYPE kafka_offset_newest gauge
kafka_offset_newest{partition="0",topic="topic1"} 11415
kafka_offset_newest{partition="1",topic="topic1"} 11355
kafka_offset_newest{partition="2",topic="topic1"} 11104
kafka_offset_newest{partition="3",topic="topic1"} 11085
kafka_offset_newest{partition="4",topic="topic1"} 11282
# HELP kafka_offset_oldest Oldest offset for a partition
# TYPE kafka_offset_oldest gauge
kafka_offset_oldest{partition="0",topic="topic1"} 0
kafka_offset_oldest{partition="1",topic="topic1"} 0
kafka_offset_oldest{partition="2",topic="topic1"} 0
kafka_offset_oldest{partition="3",topic="topic1"} 0
kafka_offset_oldest{partition="4",topic="topic1"} 0
Point your Prometheus to your exporter to fetch the metrics. We’re almost there, however the exporter does not expose the lagging number of messages itself, we’ll have to calculate this in Prometheus. This is a bit tricky:
sum(kafka_offset_newest - on(topic,partition) group_right kafka_offset_consumer) by (group, topic)
Our lag is calculated as kafka_offset_newest - kafka_offset_consumer. However since we’re doing one-to-many arithmetic, we have to group by topic and partition, much like RIGHT JOIN ... GROUP BY topic, partition in the SQL world. Lastly, sum per group and per topic to view the lag for all consumers in a group on a single topic.
Visualize with Grafana:
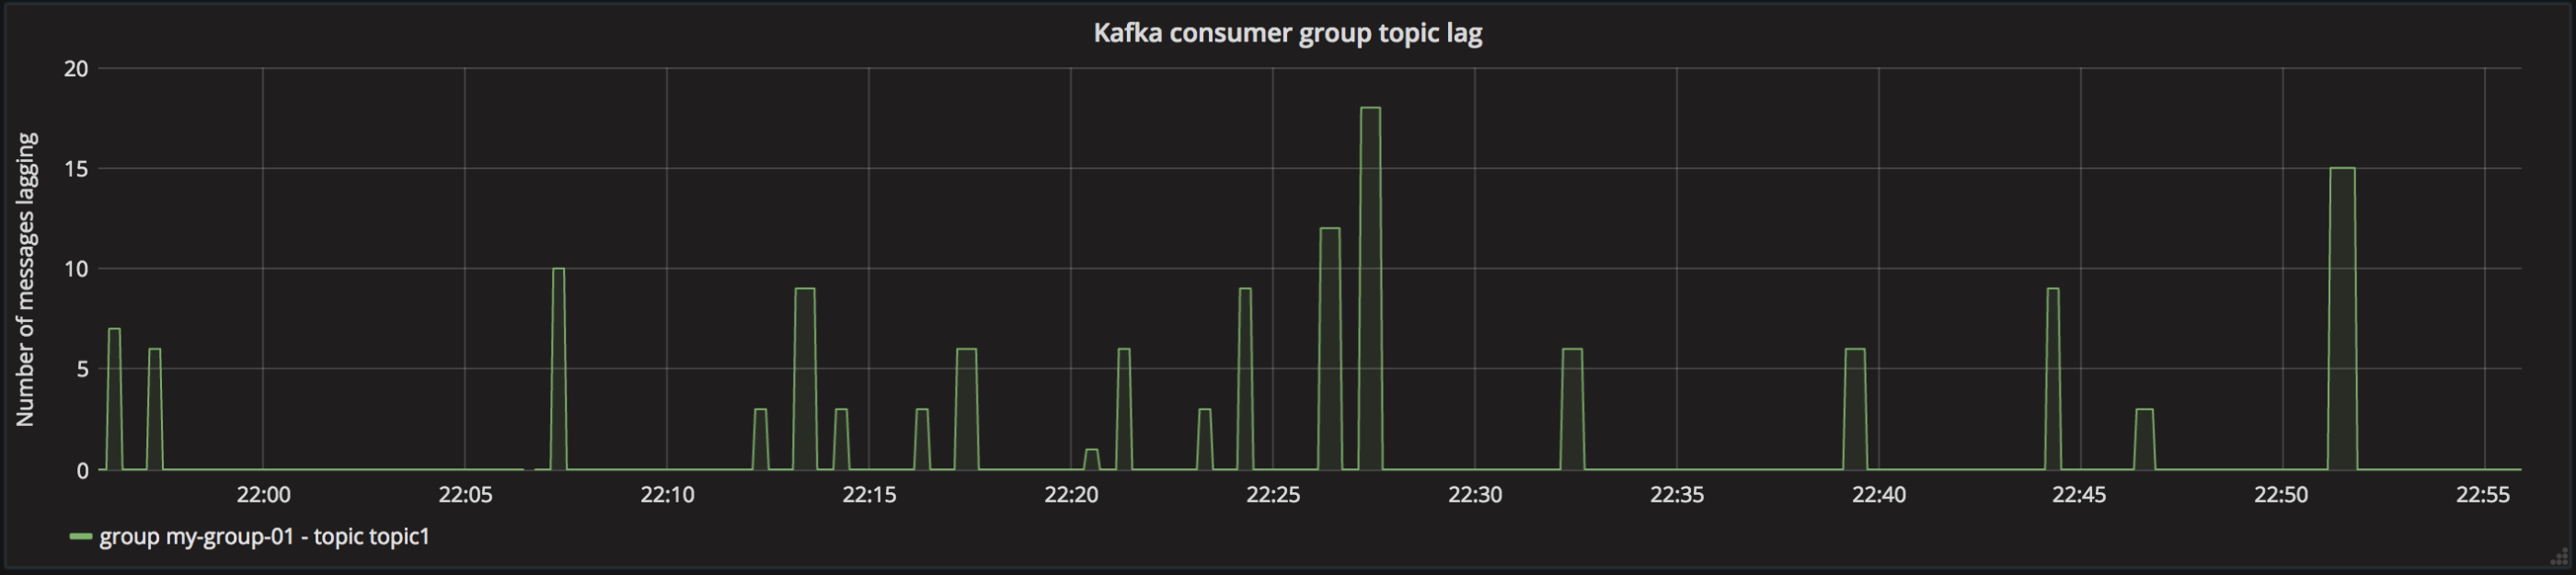
Now we have a neat dashboard displaying the lag. Often, increasing topic lag is an indicator that something’s wrong in a job, so additionally you can setup alerting on this. Good luck!

