Data | Domains
Silver Sponsorship Data Driven Commerce 
Walter van der Scheer 27 Jan, 2016


This article is featured in the free magazine "Data Science in Production
Yesterday Giovanni, our Chief Scientist, mentioned this recently released (2 days ago in github) open source forecasting API by Facebook’s Core Data Science team, so I decided to give it a try during one of our famous GDD Fridays.
In Prophet’s own words: "Prophet is a procedure for forecasting time series data. It is based on an additive model where non-linear trends are fit with yearly and weekly seasonality, plus holidays. It works best with daily periodicity data with at least one year of historical data. Prophet is robust to missing data, shifts in the trend, and large outliers". Prophet’s algorithm explanation can be found in this article.
Prophet offers a R and Python API, I used the Pythton API of course.
The data belongs to a customer for which models are alreading in production. I wanted to see how Prophet’s forecasts behave using the same data we use in one of these models developed by Rogier and me.
In reality, the forecast of the number of transactions in a shop is used as a part of an ensemble to predict products sales. Since Prophet does not accept features, it would be unfair to make a comparison at that level since, for example, price is a very important factor.
The data is of a current client, therefore I won’t be disclosing any details of it.
Our models make forecasts for different shops of this company. In particular I took 2 shops, one which contains the easiest transactions to predict from all shops, and another with a somewhat more complicated history.
The data consists of real transactions since 2014. Data is daily with the target being the number of transactions executed during a day. There are missing dates in the data when the shop closed, for example New Year’s day and Christmas.
The holidays provided to the API are the same I use in our model. They contain from school vacations or large periods, to single holidays like Christmas Eve. In total, the data contains 46 different holidays.
If the data is in a nice format (this is a big if), Prophet provides a very easy to use API. In particular, once I cleaned, aggregated and dumped the data, the calculation consisted on these two pieces of code:
def predict(tseries, predict_date, holidays=None):
    model = Prophet(holidays=holidays)
    # train on data until 3 days before
    model.fit(tseries[tseries.ds  (predict_date - timedelta(days=2))])
    forecast = model.predict(model.make_future_dataframe(periods=5))
    return forecast.loc[forecast.ds == predict_date, ['ds', 'yhat']]

pred = []
pred_holidays = []
for date in pd.date_range('2016-1-1', '2016-12-31'):
    pred.append(predict(tseries_shop, date))
    pred_holidays.append(predict(tseries_shop, date, holidays=holidays))

predictions = pd.merge(pd.concat(pred), pd.concat(pred_holidays),
                       on='ds', how='inner', suffixes=('','_hol'))
The forecast is done for 2016 with and without holiday data. Our production model gets trained daily via an Airflow job, to make a fair comparison, I train a Prophet model for each date in 2016 using the data until 3 days before the date to be forecast. This is because the order for a product needs to be submitted 2 days before, which means it uses the data available until then.
Prophet leveraged the full capacity of my laptop using all 8 cores. The calculation took around 45 minutes per shop, which means a single day with or without holidays takes around 4 seconds.
The metric I used to measure the forecast performance is the coefficient of determination ((R^2) score). The (R^2) score gives the proportion of the variance in the data that is explained by the forecast. A perfect forecast will give 1.0 and a constant prediction for every day will give 0.0.
Using Vincent’s awesome Pokemon name generator, I will call this shop Widushop. This is the transaction data for the 3 years,
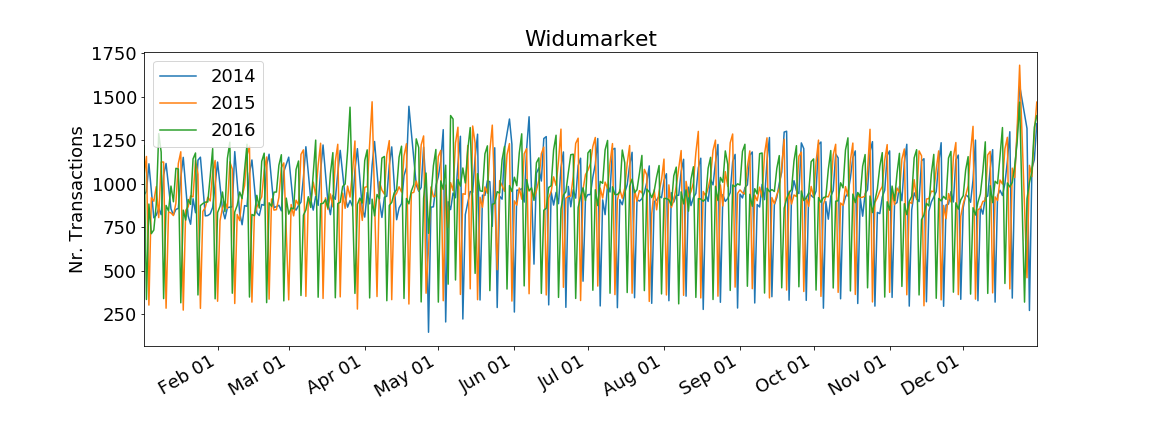
The image shows a very similar pattern each year. Also, it shows some days that are definitely holidays where transactions drop or increase dramatically.
Prophet produces a very accurate forecast, it scores 0.89 without using holidays and 0.94 using holidays. Below I show a comparison between the transactions (truth) and the forecast using holidays.
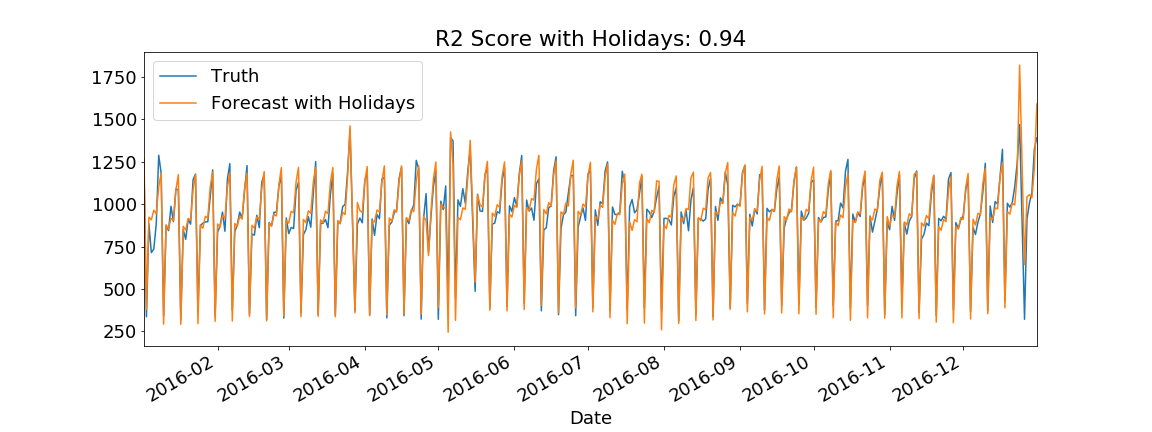
Pretty nice!
Overall it produces very good results, for holidays seems to overestimate (look at Christmas Eve), nevertheless that can be tuned by the parameter holidays.prior.scale as stated in the documentation.
This time the shop name generated is Qumashop. The transaction history of Qumashop is more chaotic than the one for Widushop. Below I show the transaction history of Qumashop.
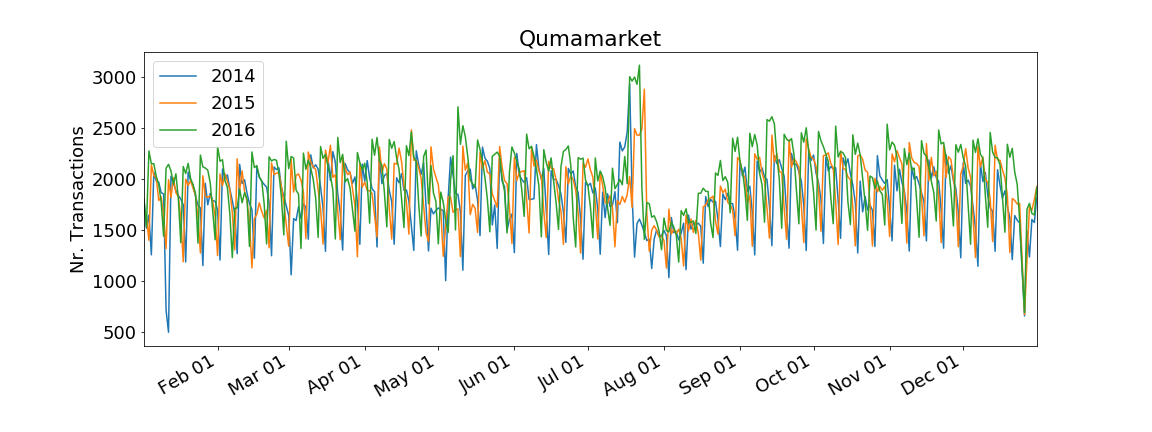
Holidays have a much greater impact. Look at that peak in the middle of July, this is a known event that draws a lot of people to the city (it is in the holidays data). Notice that transactions in 2016 are considerably higher than other years, specially from July until September. Not catching this uprise trend would mean losing a lot of potential sales.
This time the Prophet forecast is not as good as for Widushop giving 0.64 without holiday data and a solid 0.82 using holidays. Below I show a comparison between the transactions (truth) and the forecast using holidays for Qumashop.

Look at that! very nice. I am specially happy that it catched the mentioned trend between July and September. Moreover, the residuals on the week following the big peak in July, the second week in September and the two weeks at the end of October are too high.
Remember that in practice this is just a model of an ensemble, is better to have a little overall bigger residual that can reduced by other models, than having weeks with such big errors.
Perhaps the forecasts for the week after the big peak in July can improve by introducing a changepoint the last day of the peak holiday week.
Prophet’s out of the box results were impressive. The quality of the forecasts are comparable with those from our current model in production for these 2 shops.
Calculations were parallelized over all 8 cores of my machine. Training plus prediction time for each date was about 4 seconds.
The API is ridiculously easy to use and the documentation seems sufficient.
For what I can read in the documentation, Prophet does not accept features. Nevertheless, Prophet’s forecasts can be part of an ensemble that produces predictions with a higher granularity.
It would be interesting to make a comparison for every shop. I was surprised by the result on the difficult shop history.
There are also several hyperparameters that would be interesting to look into, among several, these in particular:
cap: the maximum possible value of the target.changepoint: indicate where do we expect an abrupt change in the time series.changepoint_prior_scale: related to how strongly should the model adjust to trends.holidays_prior_scale: adjust the importance of holiday effects.interval_width: sets the uncertainty interval to produce a confidence interval around the forecast. This could be very useful for monitoring the quality of the forecast. Defaults to 80%.To anyone starting a project using time-series for forecasting, I really recommend taking a close look at this tool.
Great work Prophet!
I hope this blog has been helpful and please bother me @rodagundez with your results of playing around with Prophet.

