
Are you considering to switch to electric for your next car but doubting the charging possibilities in your neighborhood? Well, I was. And I also just got certified as a Google Cloud Professional Data Engineer. Curious how I used GCP to answer my question? Read along.
Collect data
The first thing you need, to answer any question really, is data. So I set out to collect information about the usage of the electric charging stations in my neighborhood at home in Utrecht and around the GDD office in Amsterdam.
You can for example find the current available charging stations at NewMotion. You might have already guessed that I’m not going to collect this data manually. So I created a Cloud Function to collect and store data. In short, I wrote a simple collect function that requests the current status for the set of charging stations I’m interested in and which uploads the response as a blob on Google Cloud Storage. Given a dictionary of station names and identifiers this collect function looks as follows.
def collect(request):
    stations = {'station_name': 123456}
    for name, uid in stations.items():
        now = dt.datetime.now().strftime('%Y%m%d-%H%M%S')
        upload_blob(bucket_name_str='charge-stats',
                    station_status_str=get_station_status(uid),
                    destination_blob_name_str=f'{name}_{now}')
Where get_station_status simply sends a requests which returns some text data that we store in a bucket. We simply use Google Cloud Storage here because it is cheap. Also, the size of this data is not very big, so we won’t need a more optimized data storage solution. We will be able to load it all in memory. The upload_blob function looks as follows.
def upload_blob(bucket_name_str, station_status_str, destination_blob_name_str):
    """Uploads data to the bucket."""
    storage_client = storage.Client()
    bucket = storage_client.get_bucket(bucket_name_str)
    blob = bucket.blob(destination_blob_name_str)
    blob.upload_from_string(station_status_str, content_type='text/plain', client=None, predefined_acl=None)
To create your own Cloud Function you simply paste the above python code in the inline editor in main.py after choosing Python 3.7 as Runtime. In requirement.txt you specify the packages needed, here python, pandas, pytz, requests, google-cloud-storage. And finaly you specify collect as the Function to execute.
Scheduling
Next step is to make sure that this Cloud Function runs on a fixed interval to actually start collecting data. Cloud Scheduler to the rescue. It is very easy, you only have to specify the frequency, choose HTTP as target and specify the URL of your Cloud Function.
The Cloud Storage bucket I created is filling up automatically with many blobs containing information about the usage of the charging stations I’m interested in.
Prepare data
The storage bucket now contains many timestamped blobs which I need to put together to create a data set for exploration. To avoid setting up policies and access rights I use Google’s AI Platform to spin up a notebook in which I can quickly load the data from Google Storage and immediately start to explore it.
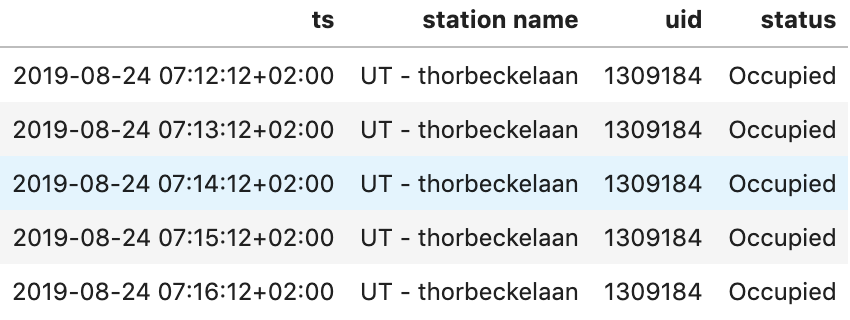
After collecting data each minute for more than two months for 14 charging stations I’ve collected almost 1.5 million blobs. Each blob contains json data from which I select the station name, a unique identifier for a pole at the station (a station can have more poles), the status of the pole and the timestamp.
Putting everything together my data set looks as follows.
Explore data
Putting everything together we have information about the usage of 5 charging station in Utrecht and 9 in Amsterdam for about 2 months. After some quick counts I found out that for 4 of the stations in Amsterdam something weird is going on. There were only very few state changes recorded for these stations, which is unexpected for their location. I suspect that either something went wrong in the data collection, maybe the stations weren’t reachable because of construction or something else is going on. Either way, their usage was so unexpected/low and different from the rest that I removed these stations for further analysis.
Time for some questions!
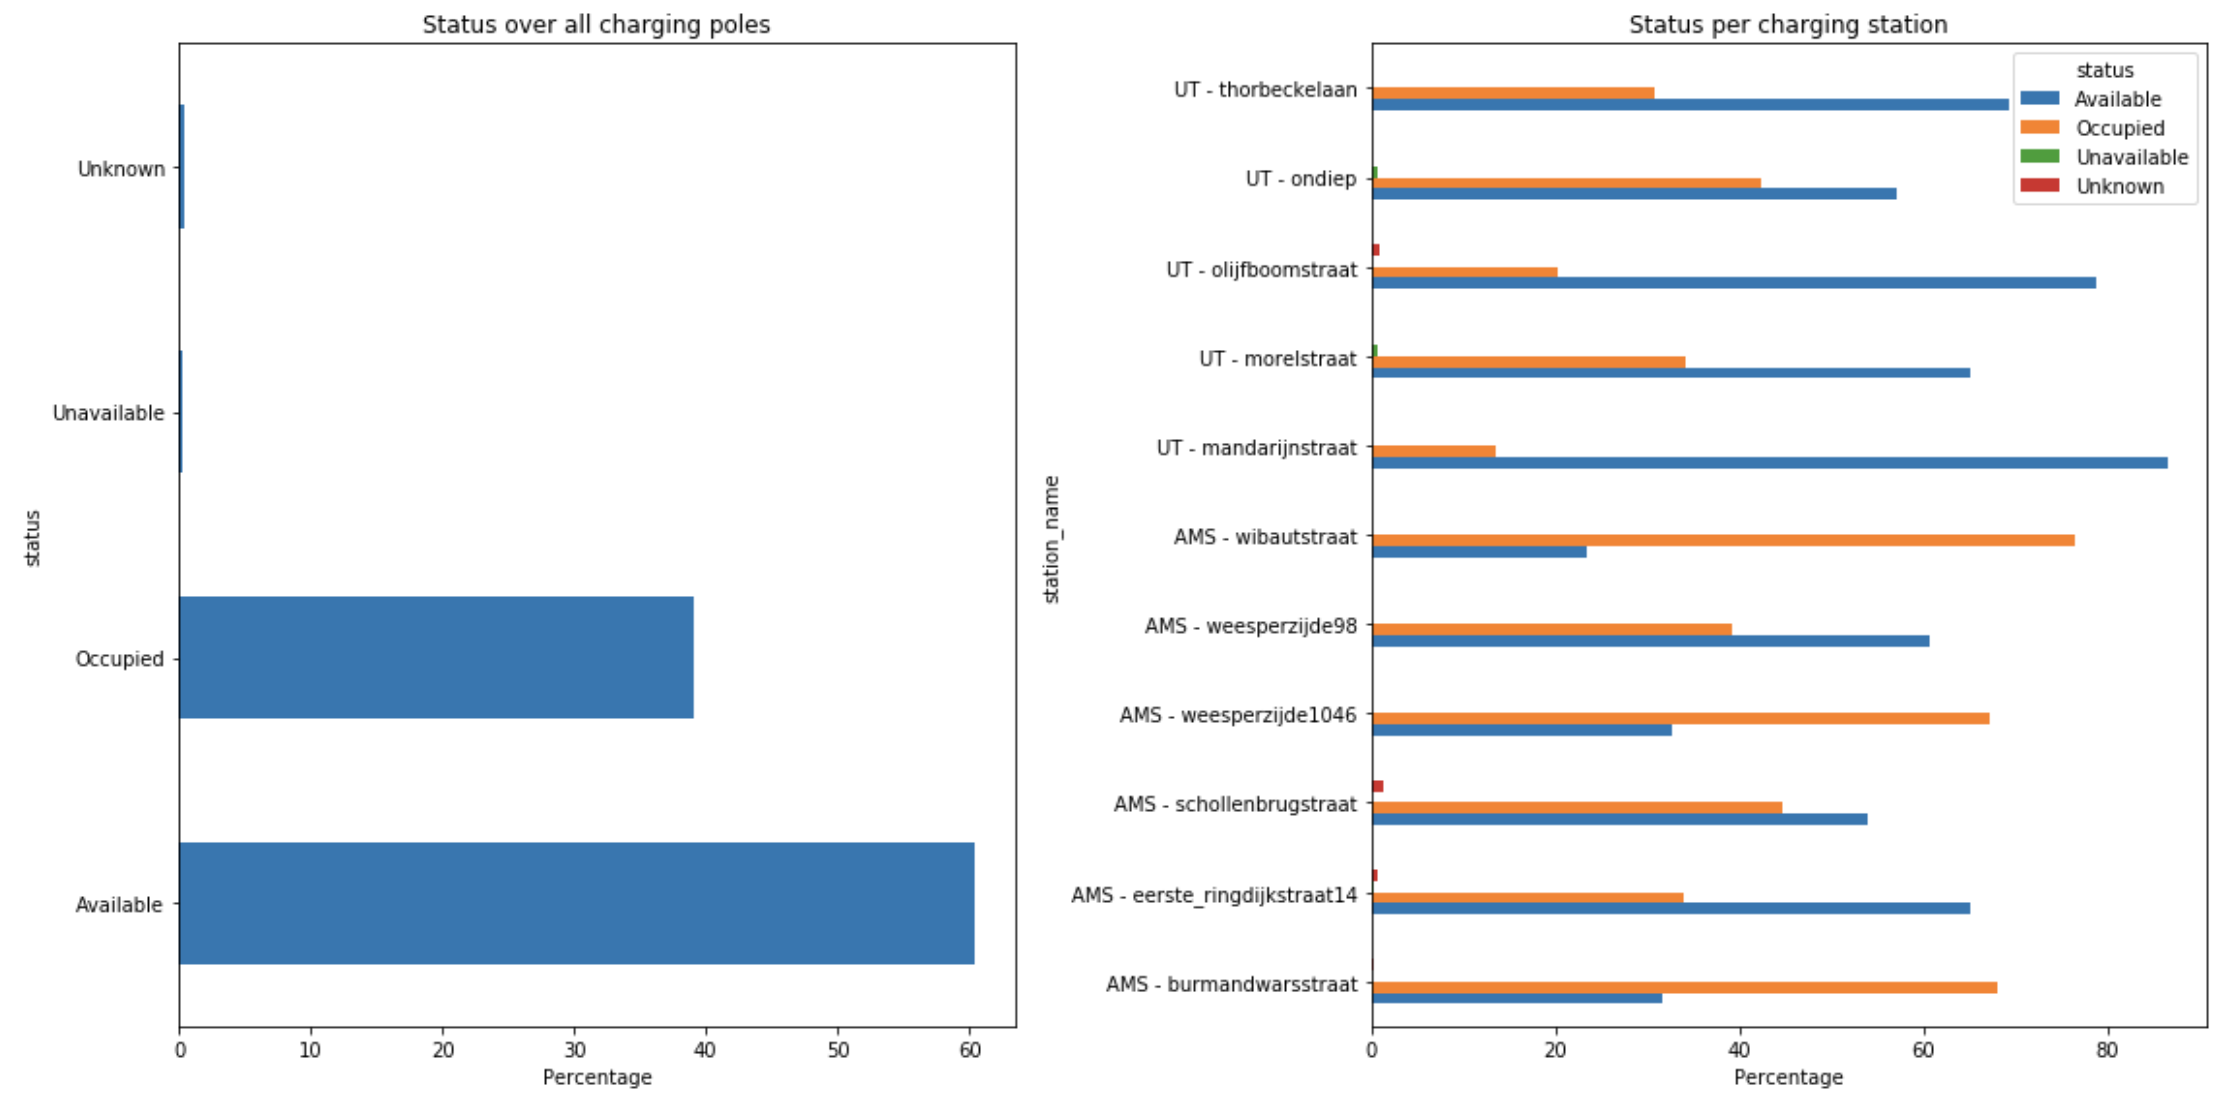
How often are the charging poles used?
Looking at all charging poles in scope we see that they are only occupied for about 39 percent of the time. There is quite some variation between stations though.
How long are the charging sessions?
The average charging session is about 10 hours (median 7 hours) and again there is quite some variation between different poles. Most notably, the different poles at the same station also differ quite much. The clearest example to see this effect is AMS – weesperzijde 98, which has the largest average on one pole and one of the smallest on the other.
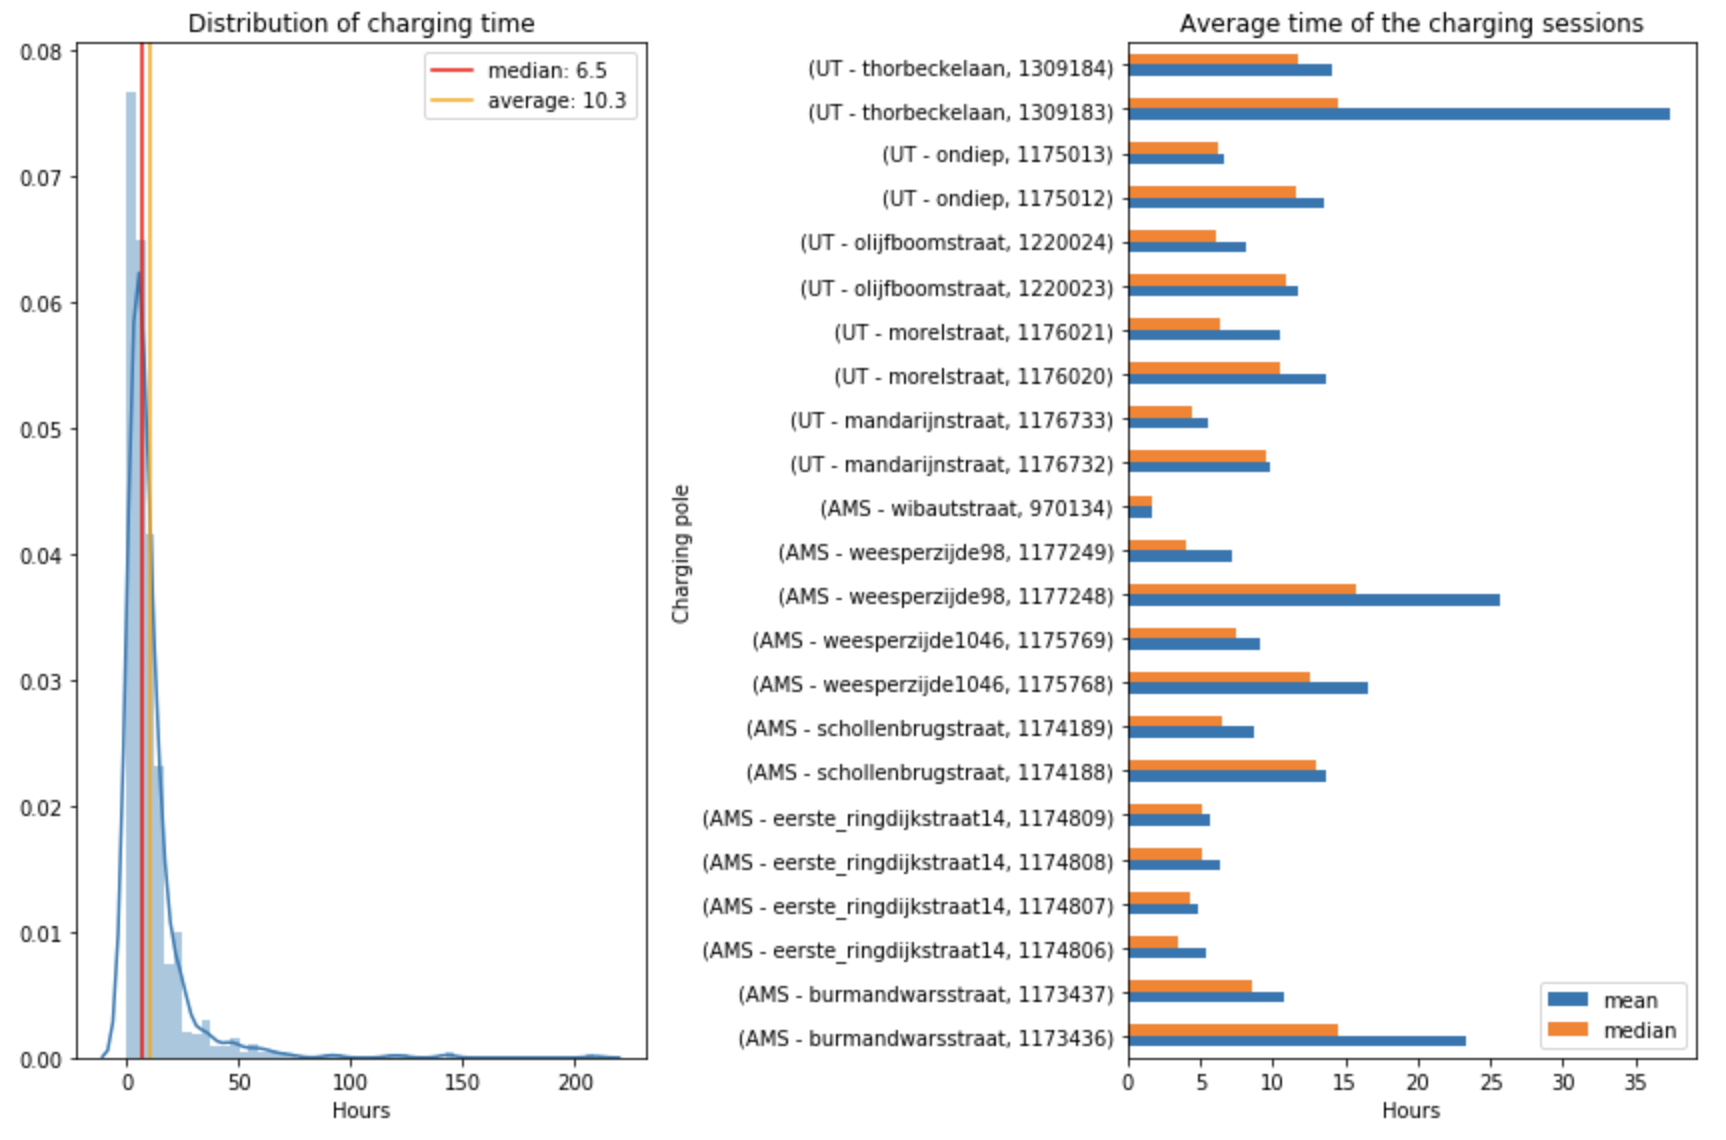
Note: a charge session is the time that a vehicle is connected to the pole (so it can be that the battery is already full).
What time of the day are people charging?
It is clear to see that most people charge overnight and start charging again when they get back from work, since the usage increases again from four o’clock in the afternoon.
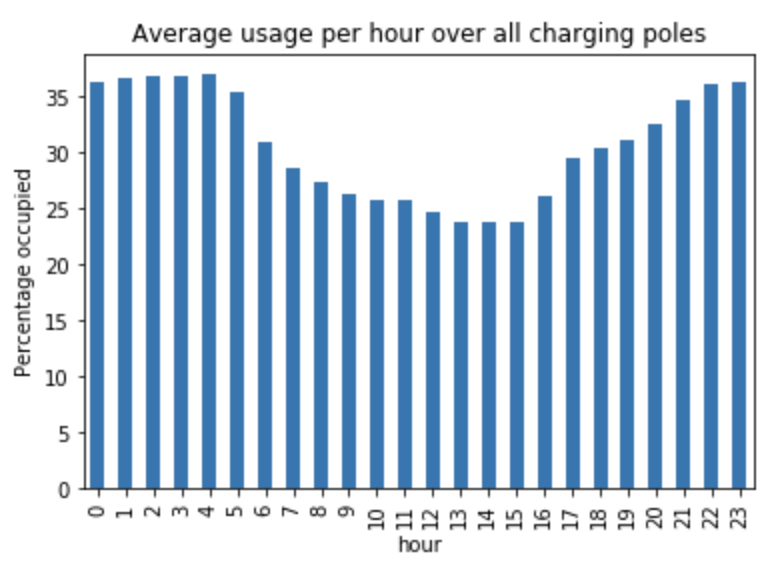
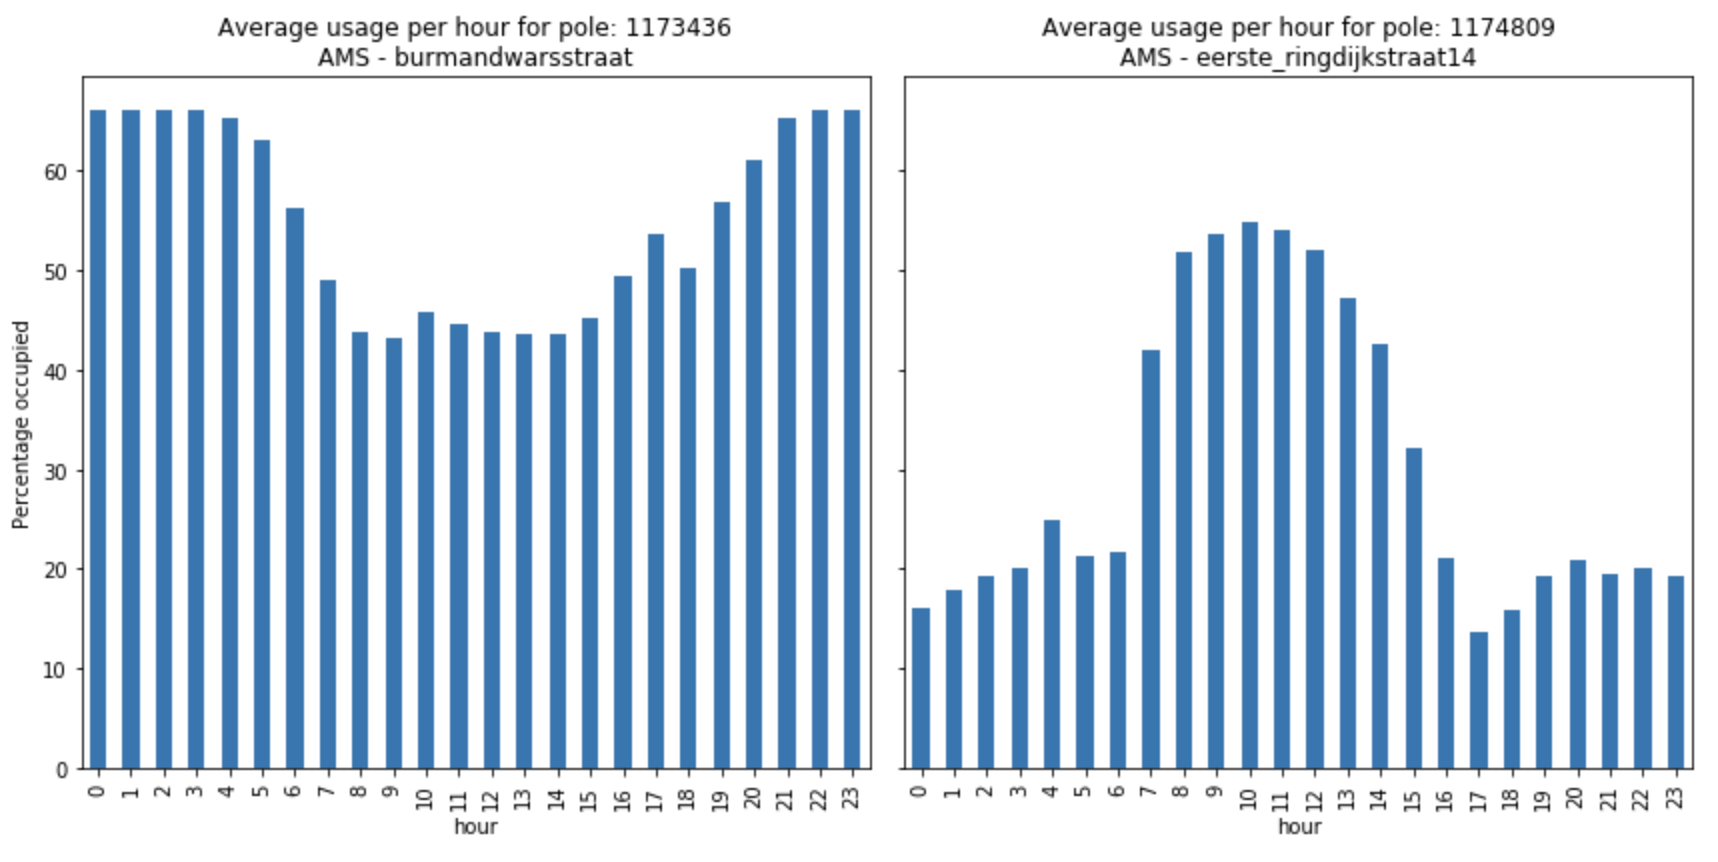
Zooming in on specific poles we clearly see two different patterns. The first pattern is the one described above; charging dip during working hours. The second patterns is the inverse of the first; charging peak during working hours.
To buy or not to buy
I found that there are more than enough charging possibilities for me both around work and at home. Especially in Utrecht the charging poles are still unoccupied most of the time.
I will be monitoring the usage to see if electric cars become more popular and the usage increases. For now I would conclude that it is safe to hop on the EV train.
Feel free to reach out if you have any questions regarding the code or technology used.


